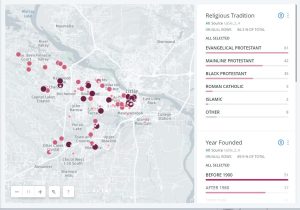
Maps are a great way to display information. They can enable you to see patterns and relationships that aren’t otherwise visible. Using Carto, an online mapping tool, the Little Rock Congregations Study research team created this map of publicly-available data on Little Rock Congregations. You can click on the map to link directly to Carto and explore the data.
You can click on the “Year Founded” tab to see the history of Little Rock’s growth through the establishment of new places of worship in new areas as the city expanded over time. The “Majority Race” tab illustrates the clear racial and geographic divisions in our city, as seen in the screenshot of the map below. The purple dots represent congregations with majority white attendees while green dots represent congregations with majority Black attendees. 
In the future, we hope to use more sophisticated mapping technology to analyze the geographic locations and characteristics of Little Rock’s congregations together with census tract data on race, income, and family characteristics. We could also compare maps of crime data with the location and characteristics of places of worship.
